Data Visualization
- Home /
- Categories /
- Data Visualization
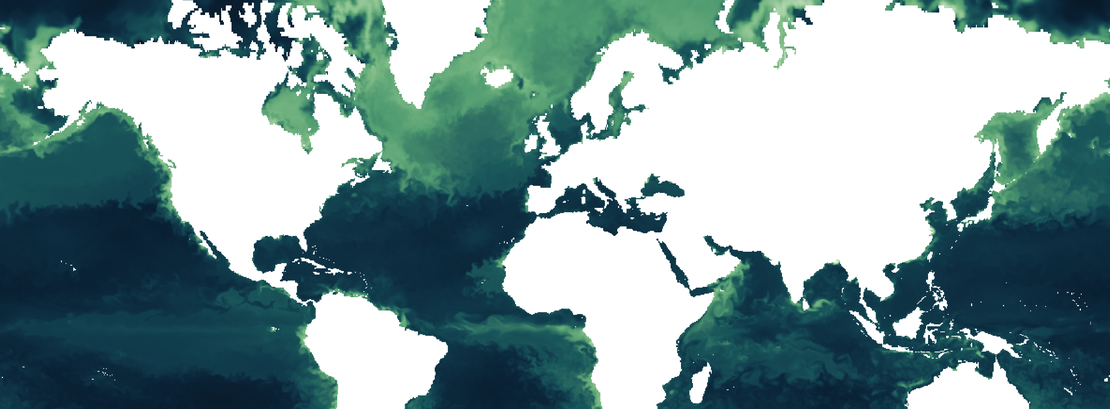
When the ocean blooms
Phytoplankton are microscopic algae. They live in surface waters and float and drift with the currents.
Read More
'Mataró out loud' wins the Catalan Dataviz Award from the ViT Foundation
The project Mataró out loud , the scrollstorytelling about noise levels in the city of Mataró, published by Mirai Data, has been recognised with the Català DataViz award and has also been a finalist in the Young Talent category of the Women DataViz 2025 Awards, organised by the ViT Foundation .
Read More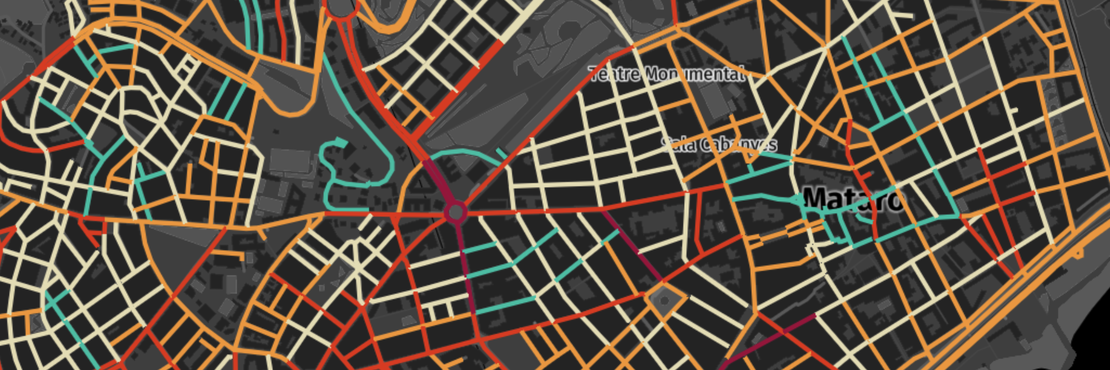
Mataró out loud
Traffic, terraces, markets, construction sites, public festivals... Everyday life in cities is noisy.
Read More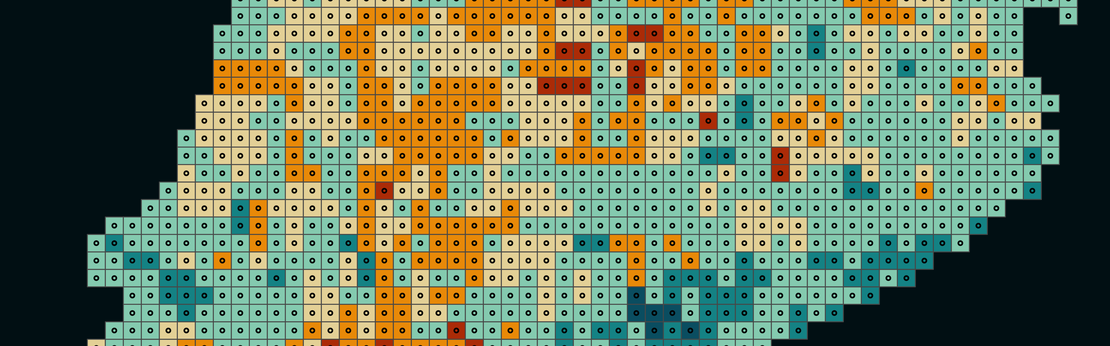
#30DayMapChallenge 2024
Similarly to the #30DayChartChallenge in which we participated in April , during November the map community celebrates the #30DayMapChallenge and we have joined in!
Read More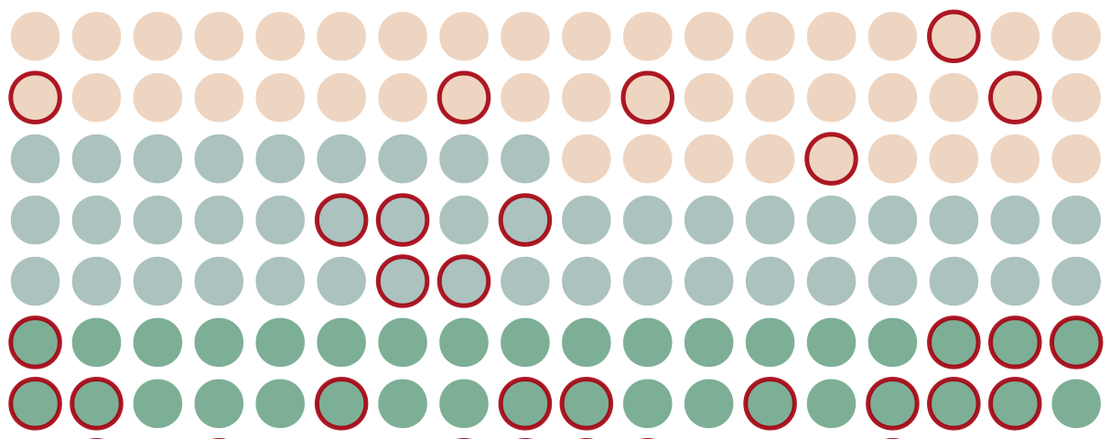
#30DayChartChallenge 2024
This year we actively participated in the #30DayChartChallenge and here are the results!
Read More