Data Visualization
- Home /
- Categories /
- Data Visualization
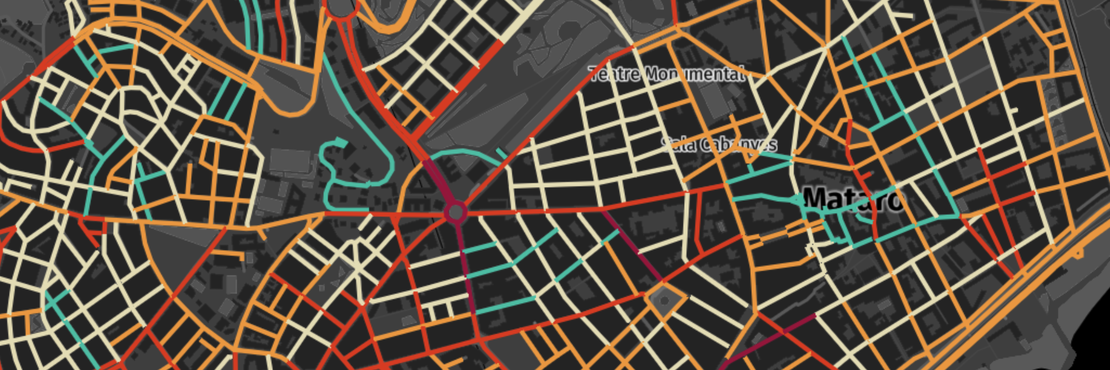
Mataró out loud
Traffic, terraces, markets, construction sites, public festivals... Everyday life in cities is noisy.
Read More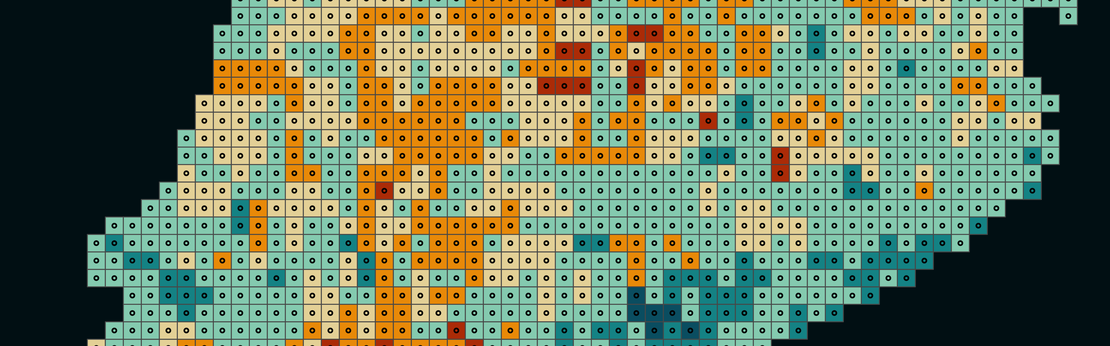
#30DayMapChallenge 2024
Similarly to the #30DayChartChallenge in which we participated in April , during November the map community celebrates the #30DayMapChallenge and we have joined in!
Read More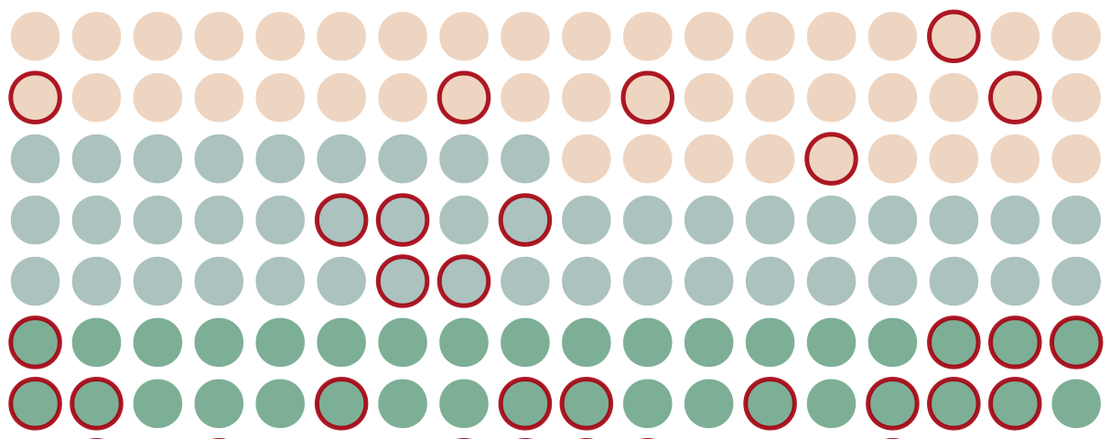
#30DayChartChallenge 2024
This year we actively participated in the #30DayChartChallenge and here are the results!
Read More